
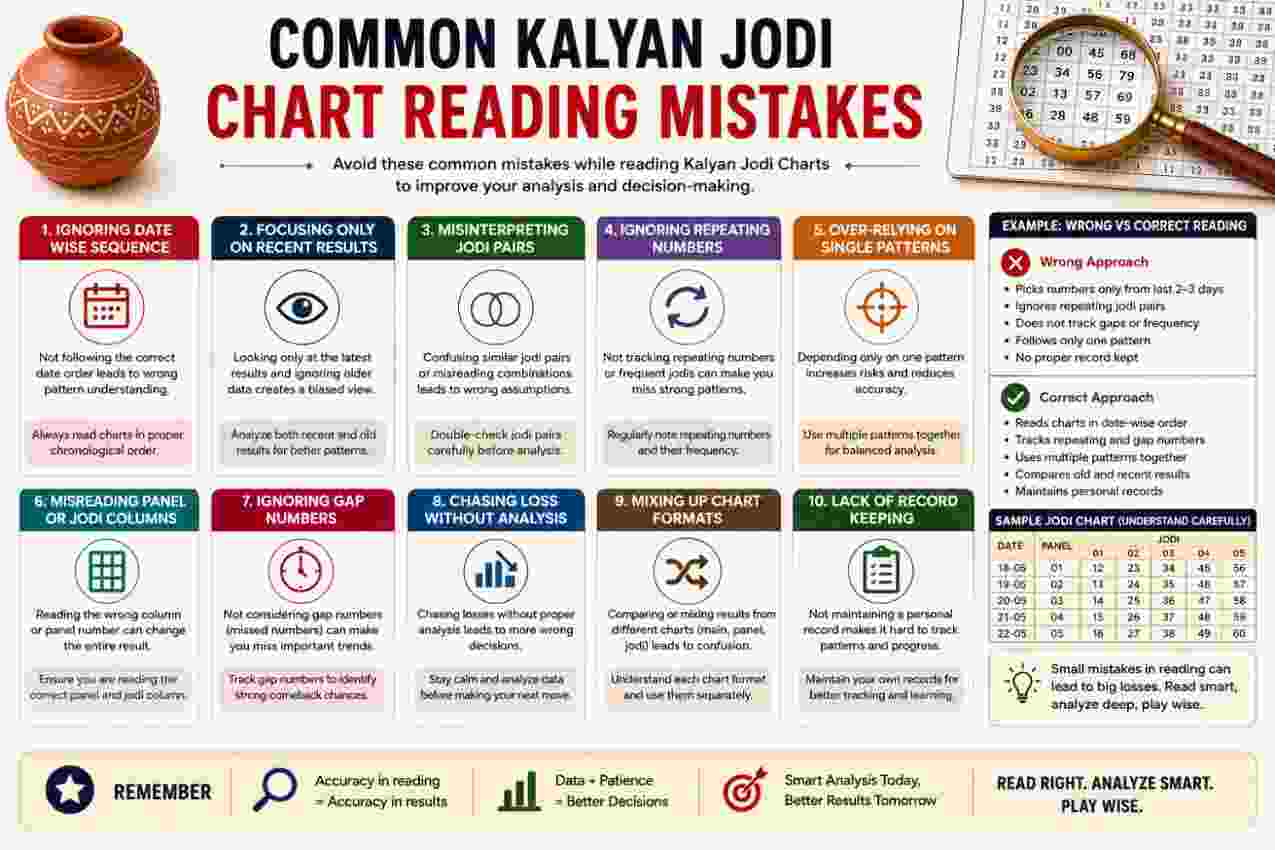
A Kalyan Jodi chart arranges historical results through dates, weekday columns, opening panels, closing panels, and paired digits. Although the structure looks straightforward, closely positioned numbers can cause frequent reading errors. A mistaken column, reversed digit, or overlooked date may change the meaning of an entire entry. Accurate reading therefore requires patience, calculation, and careful attention to layout. Readers should also remember that the chart records earlier outcomes; it does not guarantee future results or turn visible patterns into reliable predictions.
Why Reading Errors Occur?
Most mistakes arise from layout confusion rather than difficult mathematics. Charts often place several three-digit panels and two-digit pairs inside narrow rows. Consequently, readers may follow the wrong line, confuse neighbouring columns, or copy only part of an entry.
Different layouts can create further difficulty. One Kalyan Jodi chart may list weekdays horizontally, while another may organise each day vertically. Similarly, colours, symbols, and spacing may vary between records. Readers who assume every chart uses an identical format can misinterpret otherwise accurate information.
Dense Numerical Presentation
Closely packed numbers demand sustained attention. When several rows contain similar digits, the eye can unintentionally jump from one line to another. This problem becomes more likely on small screens or poorly formatted copies.
The following features commonly cause visual confusion:
- Narrow spaces between columns
- Similar three-digit combinations
- Weak row borders
- Small text
- Repeated date ranges
- Inconsistent alignment
- Missing column labels
Therefore, readers should identify the chart’s structure before interpreting individual values.
Unfamiliar Result Components
A complete entry may contain an opening panel, opening single, paired result, closing single, and closing panel. However, a reader who recognises only the central pair may misunderstand the surrounding values.
Each component serves a separate purpose. Panels contain three digits, singles contain one digit, and the Jodi contains two digits. Consequently, accurate interpretation depends on keeping these categories separate.
Mistake 1: Failing to Confirm the Chart Identity
Readers sometimes begin with the numbers without checking the chart heading. This approach can produce a perfectly copied result from the wrong record.
Overlooking the Market Name
The market name normally appears above the numerical entries. Since separate markets can operate on the same date, identical date labels do not establish chart identity. Therefore, readers should confirm the heading before locating any result.
A proper initial check should cover:
- The complete market name
- The stated year
- The month or date range
- The operating days
- The archive period
- Any opening or closing labels
Moreover, shortened or similarly spelled headings deserve careful attention. A minor naming difference may indicate a completely separate record.
Ignoring the Archive Period
Historical charts often contain several years. A reader may locate the correct day and month yet copy information from an incorrect year. Consequently, every selected entry should include three coordinates: date, month, and year.
The safest process starts with the broadest detail and moves inward. First confirm the chart identity, then the year, month, week, weekday, and result cell.
Mistake 2: Selecting the Wrong Date or Week
Date errors can shift the reading to an unrelated entry even when every copied digit remains accurate.
Misreading Weekly Date Ranges
Many charts identify each row through a starting date and ending date. Numbers across that row correspond with individual weekdays. However, readers sometimes treat the range as one result date rather than a weekly label.
For example, a row covering 5–10 August may contain separate entries for six operating days. The first value does not represent the entire period. Instead, its exact date depends on the weekday columns displayed above it.
Therefore, readers should match three elements:
- The weekly date range
- The weekday heading
- The result cell at their intersection
This approach prevents accidental movement into an adjacent day.
Confusing Date Formats
Some dates follow day-month-year order, while others use month-day-year order. A notation such as 04/08 can therefore mean 4 August or 8 April.
Nearby entries usually reveal the intended format. For instance, a sequence progressing from 04/08 to 05/08 indicates day-first notation when the rows advance daily. Additionally, month headings provide useful confirmation.
Ignoring Weeks That Cross Months
A weekly row may begin in one month and end in another. Consequently, readers sometimes assign every entry to the month printed above the row.
Instead, each weekday must correspond with its actual calendar date. Month boundaries require extra attention, particularly around the final and first days of consecutive months.
Mistake 3: Following the Wrong Row or Column
Row and column displacement ranks among the most common visual mistakes. A reader may start correctly but drift into a neighbouring cell while moving across the chart.
Losing Horizontal Alignment
Wide charts require the eye to travel from a date label to a distant weekday column. Without strong borders, the eye may move upward or downward during that journey.
Readers can reduce this risk by:
- Tracing the row slowly
- Checking the date after locating the result
- Enlarging the chart when possible
- Reading one complete entry at a time
- Comparing the cell with adjacent borders
- Avoiding hurried transcription
Moreover, alternating row colours can help, but readers should not rely on colour when the display quality remains poor.
Choosing the Neighbouring Weekday
Weekday headings may appear only once at the top. When a chart extends far downward, readers can forget which column represents a particular day.
Therefore, count the columns from a fixed edge or repeatedly return to the header. A copied number should never rely solely on an estimated column position.
Skipping a Blank Cell
A blank entry can disrupt alignment. Some readers shift later results leftward to fill the apparent gap, which assigns every following result to the wrong weekday.
Blank cells must remain in their original positions. They preserve the relationship between dates and columns even when no result appears.
Mistake 4: Confusing the Panel With the Jodi
A panel and a Jodi contain different numbers and perform separate functions. Mixing them creates fundamental interpretation errors.
Treating Three Digits as the Final Pair
An opening or closing panel usually contains three digits. In contrast, the central Jodi contains two digits formed from the opening and closing singles.
Consider the sequence 128-16-349:
- 128 represents the opening panel
- 16 represents the Jodi
- 349 represents the closing panel
A reader who records 128 as the paired result ignores the structure of the complete entry.
Misreading Compressed Formatting
Some charts remove separators and rely on spacing or colour. A compressed entry may consequently look like one long number. Readers should identify the component lengths before dividing it.
A common complete structure follows the pattern:
- Three digits for the opening panel
- Two digits for the central pair
- Three digits for the closing panel
However, formatting can vary. Therefore, column headings and surrounding entries should confirm the intended divisions.
Assuming Every Visible Number Has Equal Meaning
Large or coloured digits often attract immediate attention, but visual emphasis does not define numerical function. Position, labels, and digit length provide more reliable clues.
Mistake 5: Reversing Opening and Closing Digits
Digit order determines the Jodi. Reversing the two singles changes the recorded pair.
Placing the Closing Single First
The opening single occupies the first position, while the closing single occupies the second. If the opening side produces 3 and the closing side produces 8, the pair reads 38, not 83.
This distinction matters because both combinations represent separate values. Consequently, readers must retain the left-to-right order shown in the chart.
Reversing the Panels
The opening panel normally appears on the left of the central pair, while the closing panel appears on the right. Swapping them changes which single each panel produces.
A reliable check involves calculating both sides:
- Add the opening panel digits.
- Retain the final digit of the total.
- Place that digit first.
- Add the closing panel digits.
- Retain the final digit.
- Place that digit second.
Therefore, calculation confirms both identity and order.
Mistake 6: Calculating Panel Totals Incorrectly
Panel calculations look simple, yet rushed addition causes frequent mistakes.
Keeping the Entire Total
A panel produces a single digit through the last digit of its sum. For example, 167 totals 14, so the corresponding single equals 4. Using 14 as the single breaks the chart’s structure.
Similarly:
- 235 totals 10 and produces 0
- 478 totals 19 and produces 9
- 689 totals 23 and produces 3
Consequently, readers must separate the full sum from the final single.
Dropping Zero Results
When a panel total ends in zero, the single remains 0. Some readers omit it because they treat zero as empty. However, zero carries full numerical significance within a paired result.
If the opening single equals 0 and the closing single equals 7, the Jodi should appear as 07. Removing the leading zero changes its format and may create ambiguity.
Adding Only Two Digits
Every digit in the three-digit panel contributes to the total. Visual spacing or faint printing may cause a reader to overlook one digit. Therefore, each calculation should begin by identifying all three values clearly.
Relying on Mental Calculation Alone
Mental addition can save time, but repeated calculations increase the chance of error. Writing the sum or checking it twice provides greater accuracy, particularly when copying many entries.
Mistake 7: Ignoring Leading Zeros
Zero often creates formatting mistakes because spreadsheet programs, note applications, and manual transcriptions may remove it automatically.
Changing a Two-Digit Pair
A Jodi such as 03 must retain both digits. If a system converts it to 3, the record no longer displays the original two-digit structure.
Likewise, pairs such as 00, 01, 05, and 09 require leading zeros. Therefore, readers should store Jodis as text when software removes the first zero.
Altering Panels Containing Zero
Panels may include zero in any position. A value such as 047 differs visually from 47 because the panel requires three digits. Although both forms may produce the same arithmetic sum, the shortened form fails to preserve the recorded entry.
Accurate transcription should retain:
- Leading zeros
- Internal zeros
- Repeated zeros
- Two-digit Jodi formatting
- Three-digit panel formatting
Moreover, preserving the original structure makes later verification easier.
Mistake 8: Treating Blank Cells as Numerical Results
Empty spaces, dashes, and symbols do not automatically represent zero.
Assuming Blank Means 00
A blank cell may indicate a holiday, market closure, delayed result, missing record, or unavailable information. Entering 00 creates data that the chart never displayed.
Therefore, readers should preserve the cell as blank unless a clear legend assigns it another meaning.
Replacing Symbols Without Confirmation
Charts may use asterisks, dashes, crosses, or abbreviated notes. Their meaning depends on the surrounding layout. A dash might mark closure, while an asterisk might indicate incomplete information.
Readers should record symbols exactly as shown. Additionally, they should avoid inventing replacements based on nearby patterns.
Moving Results Into Empty Positions
An empty weekday cell does not justify shifting the next result into its place. Each cell retains a fixed date relationship. Consequently, moving values destroys chronological accuracy across the row.
Mistake 9: Overlooking Typographical or Formatting Problems
Not every apparent inconsistency results from reader error. Historical records may contain unclear characters, broken alignment, or incorrect calculations.
Confusing Similar Digits
Small fonts can make 3 resemble 8, 1 resemble 7, or 5 resemble 6. Poor image quality increases this risk. Therefore, readers should compare unclear digits with the same font elsewhere in the chart.
A panel calculation can also help. If one possible reading matches the central single while another does not, the mathematical relationship provides useful evidence. However, readers should mark unresolved entries as uncertain rather than silently changing them.
Trusting Every Printed Value Automatically
A displayed sequence may contain a typographical mistake. For example, the panels may calculate singles that do not match the central pair.
When this happens, readers should:
- Recheck every digit
- Confirm panel positions
- Repeat both sums
- Inspect the date and row alignment
- Preserve the original value
- Mark the inconsistency for review
Consequently, verification protects accuracy without rewriting historical data.
Mistake 10: Copying Entries Without Verification
Transcription errors can occur even when the source remains clear.
Recording Only the Central Pair
The Jodi may satisfy a quick search, but copying its date, panels, and weekday creates a stronger record. Supporting details allow later verification and expose accidental digit reversals.
A useful record includes:
- Market identity
- Full date
- Weekday
- Opening panel
- Jodi
- Closing panel
- Original symbols or notes
Checking Against Memory
Memory provides a weak verification method when several similar numbers appear together. Instead, readers should compare the copied entry directly with the original cell.
Reviewing Too Late
A large batch of copied values becomes harder to check because the reader must relocate every source entry. Therefore, verify each row immediately or work in small groups.
Mistake 11: Assuming Repetition Creates Certainty
Historical charts often contain repeated pairs, panels, doubles, and number sequences. These patterns can appear meaningful, but appearance alone does not establish predictability.
Treating Frequency as a Promise
A number that appeared often during one period does not have to appear again. Similarly, a long absence does not make a result due.
The chart records what happened, not what must happen next. Consequently, frequency should remain a historical observation rather than a guaranteed forecast.
Using Short Samples
A small group of rows can exaggerate repetition. Three similar outcomes may look like a strong sequence even though a longer record shows no stable relationship.
Moreover, selecting only convenient examples creates confirmation bias. Readers may notice successful matches while ignoring contradictory entries.
Forcing Patterns Into Random Data
Humans naturally recognise shapes and sequences. However, uncertain numerical outcomes can produce clusters, reversals, and symmetrical pairs without following a dependable rule.
Responsible interpretation separates these concepts:
- Recorded fact from speculation
- Frequency from certainty
- Coincidence from causation
- Visual pattern from proven relationship
- Historical comparison from prediction
Mistake 12: Using Inconsistent Recording Methods
Even accurately read entries can become confusing when stored without a consistent format.
Mixing Date Styles
Using 08/04 for one entry and 4 August for another can create ambiguity. A fixed format, such as 04-August-2026, makes the date immediately clear.
Removing Separators
A full entry such as 128-16-349 becomes difficult to read when written as 12816349. Hyphens or separate fields preserve the opening panel, Jodi, and closing panel divisions.
Omitting Context
A copied number without its market, year, or weekday may become unusable later. Therefore, every record should include enough information to locate the source position again.
Correcting Source Data Silently
If a calculation appears inconsistent, readers should not replace the displayed number without recording the original. Instead, keep the source value and add a clear note describing the possible error.
A Reliable Reading and Verification Process
A consistent method reduces visual, mathematical, and transcription mistakes.
Check the Structure First
Before reading any result, identify the headings, weekday order, date format, panel placement, and symbol conventions. This brief inspection creates a mental map of the chart.
Read One Entry in Sequence
Follow the information from left to right:
- Confirm the weekly row.
- Locate the weekday column.
- Read the opening panel.
- Identify the central Jodi.
- Read the closing panel.
- Calculate both singles.
- Compare them with the pair.
Record the Full Context
Write the date, weekday, panels, pair, and any displayed symbol. Additionally, preserve leading zeros and original separators.
Complete a Final Cross-Check
Return to the chart and compare every copied digit. Then verify the year and market heading again. This final check catches errors that arithmetic alone cannot identify.
Responsible Interpretation of Chart Records
A kalyan jodi chart functions as an organised historical record. It can support date checking, result verification, and structured comparison across earlier periods.
However, no chart can guarantee a future numerical outcome. Repeated pairs and visible sequences may occur naturally without creating a dependable prediction method. Therefore, responsible readers should avoid certainty claims and treat every pattern as an observation only.
Additionally, activities connected with wagering may face legal restrictions in different locations. Readers should follow applicable laws, protect personal finances, and avoid decisions based on promised returns. Historical information gains value through accurate interpretation, not exaggerated claims.
Conclusion
Accurate chart reading depends on structure, alignment, calculation, and disciplined verification. Readers should confirm the market, year, date, weekday, opening panel, paired digits, and closing panel before recording any entry. They must also preserve leading zeros, blank cells, separators, and unusual symbols. Moreover, checking panel sums can reveal reversed digits or unclear characters. A kalyan jodi chart provides historical information, not guaranteed predictions. Careful interpretation therefore protects record accuracy while preventing false assumptions based on repetition, frequency, or visually appealing numerical patterns.
FAQs
How can a reader avoid selecting the wrong weekday column?
Start with the weekly date range, trace the row horizontally, and repeatedly check the weekday heading above the chosen column. Blank cells must remain in place because they preserve alignment. Enlarging the chart and verifying the selected date after copying the result can further reduce column-shift mistakes.
Why must leading zeros remain in a Jodi?
A Jodi always uses two-digit positions. Therefore, 04 represents a complete pair, while 4 shows only one digit and loses the original format. Readers should preserve leading zeros during manual transcription and store paired results as text when spreadsheet software removes zeros automatically.
How can panel calculations reveal a reading mistake?
Add the three digits in each panel and keep the final digit of each total. The opening result should match the first Jodi digit, while the closing result should match the second. A mismatch may reveal a misread character, reversed panel, incorrect column, or source inconsistency.
What should readers do when a chart contains a blank cell?
Keep the cell blank and maintain its original weekday position. A blank may indicate closure, missing information, or an unavailable result; it does not automatically mean zero. Readers should also retain any dash or symbol exactly as displayed unless the chart clearly defines a replacement value.
Can repeated Jodis reveal the next result?
Repeated Jodis show only that particular pairs appeared more than once in the recorded period. They do not guarantee another occurrence or establish a reliable sequence. Readers should treat repetitions as historical observations and avoid converting frequency, absence, or visual symmetry into claims about future outcomes.
What information should accompany a copied result?
A reliable record should include the market identity, full date, year, weekday, opening panel, two-digit Jodi, closing panel, and any source symbol. These details preserve context, support later verification, and reduce the risk of confusing similar entries from different rows, months, or archived periods.