
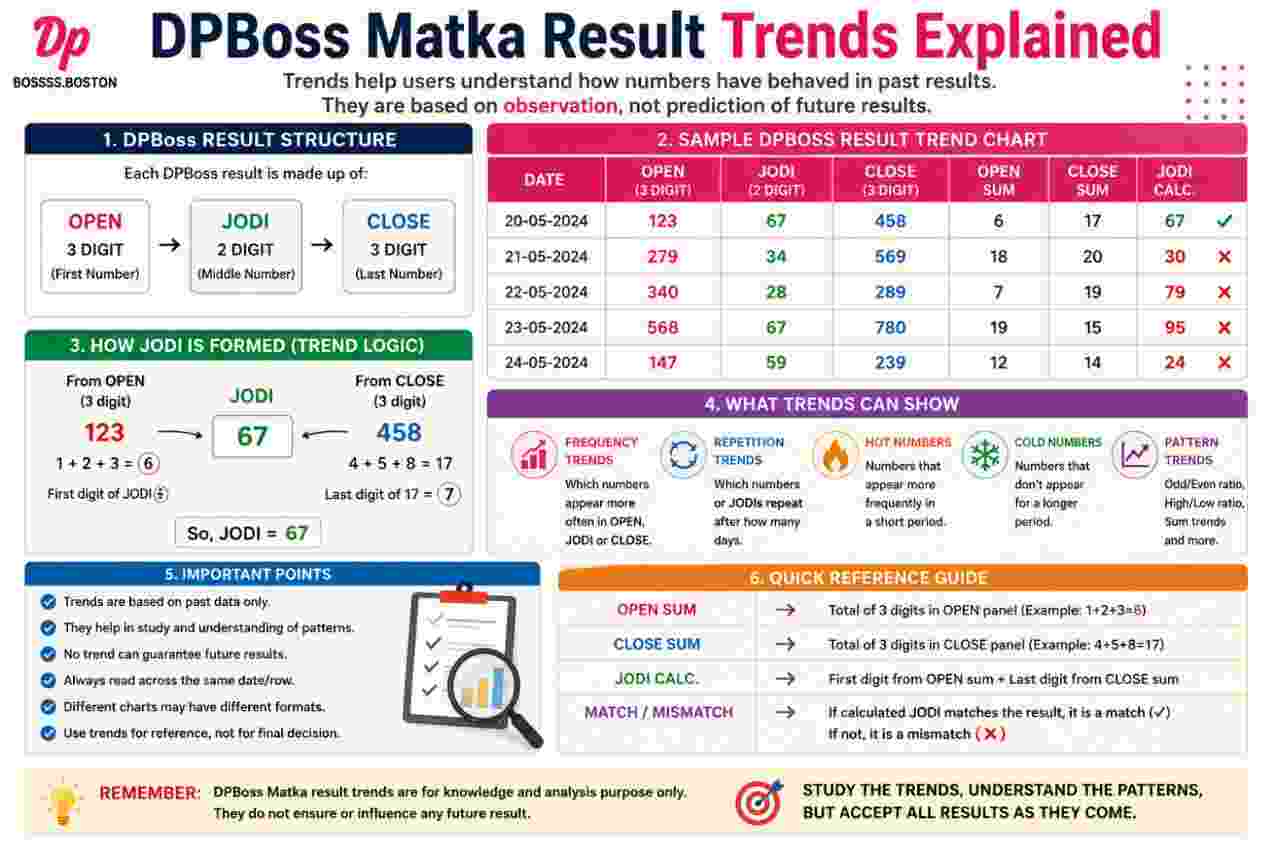
DPBoss Matka result trends describe visible patterns within historical records, including recurring digits, jodi sequences, panel frequencies, and intervals between appearances. These patterns can help readers organise past data and check how results changed across specific periods. However, historical movement does not provide a dependable method for predicting later outcomes. Random results naturally produce repetitions, clusters, gaps, and unusual sequences. Accurate analysis therefore requires proper date alignment, careful calculations, a sufficient sample, and a clear distinction between factual observations and unsupported forecasts.
What Result Trends Actually Represent
A result trend shows how recorded outcomes appeared across a defined period. It may relate to single digits, Jodi pairs, opening panels, closing panels, totals, repetitions, or gaps.
However, a trend only describes recorded history. It does not prove that the same behaviour will continue. Readers should therefore treat trend analysis as a method of organising past information rather than a forecasting system.
Historical Patterns Versus Future Predictions
A historical pattern comes directly from recorded results. For example, a digit may have appeared eight times during a month, while another appeared only twice. Those counts represent verifiable historical facts.
A prediction makes a claim about an outcome that has not occurred. Since historical frequency cannot control a random future result, the prediction remains uncertain.
This distinction matters because readers often mistake repetition for momentum. Similarly, a long absence may create the impression that a digit must appear soon. Neither conclusion follows automatically from the data.
Why Random Data Produces Visible Patterns
Random sequences rarely look perfectly balanced over short periods. Instead, they often contain:
- Repeated digits
- Consecutive jodis
- Long gaps
- Short clusters
- Similar panel totals
- Uneven opening and closing frequencies
- Runs involving odd or even digits
Consequently, visible order does not always indicate a meaningful mechanism. Chance alone can produce patterns that appear intentional.
The Main Components of Matka Results
Trend analysis becomes clearer when readers separate a complete result into its individual parts. Each component supports a different type of historical comparison.
A typical result contains an opening panel, opening single, jodi, closing single, and closing panel. Although layouts vary, the numerical relationship remains consistent.
Opening Panel
The opening panel contains three digits. Adding those digits and retaining the last digit of the total produces the opening single.
For example:
- Opening panel: 137
- Calculation: 1 + 3 + 7 = 11
- Opening single: 1
Researchers may count how frequently particular opening panels or opening singles appeared within a selected period.
Closing Panel
The closing panel also contains three digits. Its digit total produces the closing single through the same calculation.
For example:
- Closing panel: 289
- Calculation: 2 + 8 + 9 = 19
- Closing single: 9
Opening and closing panel records should remain separate because they represent different stages of the declared result.
Jodi Result
A jodi combines the opening single and closing single in that order. If the opening single is 1 and the closing single is 9, the jodi becomes 19.
Therefore, reversing the pair changes the recorded result. A jodi of 19 cannot be counted as 91, even though both contain the same digits.
Single Digits
Singles range from 0 through 9. Researchers can examine opening singles, closing singles, or both datasets separately.
However, combining opening and closing digits without identifying their positions can distort the findings. Clear labels prevent this problem.
How to Prepare Result Data for Analysis
Reliable trend analysis begins with clean records. Incorrect dates, missing zeros, reversed jodis, and duplicated entries can create patterns that never existed.
Before examining any trend, readers should standardise the source data and verify every entry.
Select a Defined Period
Choose an exact start date and end date. A fixed period prevents selective inclusion, which occurs when someone adds or removes records because they support a preferred conclusion.
Suitable periods may include:
- One calendar week
- One complete month
- Three consecutive months
- Six months
- One full year
Longer periods provide more observations. Nevertheless, a larger sample does not turn historical patterns into certain forecasts.
Arrange Entries Chronologically
List results from the earliest date to the latest. Chronological order helps reveal repetitions, gaps, and changes in frequency.
Additionally, include blank dates or closed sessions as clearly marked entries. Removing them can make two nonconsecutive results appear consecutive.
Standardise Number Formatting
Always retain two digits for jodis, including pairs that begin with zero. Write 03, 07, and 09 instead of 3, 7, and 9.
Similarly, preserve every digit in a panel. A panel of 110 should remain 110 rather than 11. Consistent formatting makes counting and comparison more accurate.
Check Internal Calculations
Recalculate the opening and closing singles from their panels. The first digit should match the opening single, while the second should match the closing single.
For example:
- Opening panel: 246
- Opening total: 12
- Opening single: 2
- Closing panel: 349
- Closing total: 16
- Closing single: 6
- Correct Jodi: 26
Any mismatch may signal a transcription or source error.
Frequency Trends in Single Digits
Frequency analysis counts how often each digit appeared during the selected period. It offers a simple summary of historical distribution.
Readers commonly call frequently appearing digits “hot” and less frequent digits “cold.” However, these labels describe past counts only.
Calculating Digit Frequency
Create separate counts for opening and closing singles. Suppose 30 opening results contain the following frequencies:
- Digit 0 appeared twice
- Digit 1 appeared four times
- Digit 2 appeared five times
- Digit 3 appeared once
- Remaining digits filled the other results
These figures show an uneven monthly distribution. Nevertheless, they do not establish which digit will appear next.
Comparing Opening and Closing Frequencies
A digit may appear frequently on the opening side but rarely on the closing side. Therefore, combining both positions may hide useful distinctions within the historical record.
For clearer analysis, maintain three views:
- Opening single frequency
- Closing single frequency
- Combined single frequency
The first two views retain position-specific information, while the combined count offers a broad distribution summary.
Why Small Samples Can Mislead
A digit appearing three times in one week may seem unusually frequent. Yet a single week contains too few observations to establish a stable long-term pattern.
Moreover, random variation has a stronger visual effect in small datasets. Expanding the period may reduce or reverse the apparent imbalance.
Hot and Cold Number Interpretations
Hot and cold classifications remain popular because they simplify frequency information. However, the labels can encourage faulty assumptions when readers use them as predictions.
A hot number has appeared relatively often during a chosen period. In contrast, a cold number has appeared relatively rarely.
The Hot-Hand Assumption
The hot-hand assumption suggests that a frequently appearing digit will keep appearing. For instance, if digit 6 appeared repeatedly during a week, someone might expect another 6 soon.
Past repetition, however, does not create momentum in an independent random process. The next result does not owe continuity to earlier outcomes.
The Due-Number Assumption
The due-number assumption takes the opposite position. It suggests that a digit missing for a long period must appear soon.
This belief reflects the gambler’s fallacy. A long gap describes the past, but it does not force the next outcome to correct the imbalance.
Using the Labels Responsibly
Hot and cold labels can support historical summaries when readers attach the period and count. For example, “Digit 4 appeared most often during the selected 30 sessions” states a measurable fact.
In contrast, “Digit 4 will remain hot” turns that observation into an unsupported forecast.
Jodi Frequency and Repetition Trends
Jodi analysis examines two-digit combinations from 00 through 99. Since 100 possible pairs exist, exact repetitions usually occur less frequently than single-digit repetitions.
Even so, short clusters and repeated jodis can appear naturally.
Direct Jodi Repetition
A direct repetition occurs when the same pair appears again. It may happen on consecutive sessions or after an interval.
For example:
- Monday: 24
- Tuesday: 61
- Wednesday: 24
Here, 24 repeats after one different result. The repetition remains historically notable, but it does not establish a repeating cycle.
Reverse Jodi Patterns
A reverse pattern occurs when a pair later appears in reversed order. For instance, 27 may be followed by 72.
Although the two results look connected, each remains a separate jodi. Researchers should count them independently before noting the reverse relationship.
Family Groupings
Some readers group jodis by shared digits, shared totals, or reversed structures. Such categories may simplify record organisation.
However, flexible grouping creates a risk: almost every result can appear connected when someone changes the grouping rule after seeing the data. Therefore, define every category before beginning the analysis.
Panel Trends and Their Categories
Panel analysis focuses on complete three-digit results. Because panels contain more information than singles, readers can examine structural features as well as exact repetition.
Common categories include single-panna, double-panna, and triple-panna patterns.
Single-Panna Results
A single-panna panel contains three different digits, such as 137, 249, or 568.
Researchers may track:
- Exact panel frequency
- Associated single frequency
- Opening or closing position
- Time between appearances
- Total value of the three digits
Since many possible combinations exist, exact repetitions may remain uncommon in short samples.
Double-Panna Results
A double-panna panel contains one repeated digit, such as 113, 225, or 668.
These panels may appear visually prominent because repetition attracts attention. Nevertheless, their memorable structure does not make them more predictive than less noticeable results.
Triple-Panna Results
A triple-panna panel contains three identical digits, such as 111, 444, or 777.
Triple panels occur within a smaller, distinctive category. Therefore, readers often remember them more easily than ordinary panels. This memory effect can make them seem more frequent or significant than the complete record supports.
Panel Total Comparisons
Two different panels can produce the same single. For example:
- 137 totals 11 and produces 1
- 245 totals 11 and produces 1
- 489 totals 21 and also produces 1
Consequently, a single-digit trend does not necessarily indicate repetition among exact panels.
Gap Analysis Between Appearances
Gap analysis measures how many sessions pass between appearances of a digit, Jodi, or panel. It can describe historical intervals clearly, provided readers calculate gaps consistently.
A gap should count completed sessions rather than calendar days unless the analysis specifically concerns dates.
Counting a Basic Gap
Suppose digit 5 appears on session 2 and then reappears on session 7. Sessions 3, 4, 5, and 6 fall between the appearances.
Therefore, the gap equals four completed sessions. Some analysts count the distance as five positions, so the chosen method must remain clearly defined and consistent.
Open Gaps Versus Closed Gaps
A closed gap ends when the selected number reappears. An open gap continues through the latest available record because no new appearance has closed it.
Readers should label these separately. Treating an open gap as complete can produce misleading averages.
Why Long Gaps Do Not Create Certainty
A digit can remain absent longer than its previous maximum gap. No mathematical rule forces it to return after reaching an average or historical limit.
Accordingly, gap statistics describe intervals already observed. They cannot establish a deadline for the next appearance.
Odd, Even, High, and Low Trends
Category analysis reduces individual digits into broader groups. This approach can make long records easier to summarise.
However, category definitions must remain fixed throughout the analysis.
Odd and Even Distribution
Odd digits include 1, 3, 5, 7, and 9. Even digits include 0, 2, 4, 6, and 8.
Researchers may count odd and even opening singles, closing singles, or complete jodis. For jodis, they should specify whether the category depends on the first digit, second digit, or both.
High and Low Classifications
A common division treats 0 through 4 as low and 5 through 9 as high. Yet another source may apply a different boundary.
Therefore, state the definition before presenting counts. Without a declared rule, readers cannot accurately interpret the comparison.
Mixed Jodi Structures
A jodi can contain:
- Two low digits
- Two high digits
- A low opening digit and high closing digit
- A high opening digit and low closing digit
- Two odd digits
- Two even digits
- One odd digit and one even digit
These classifications provide descriptive summaries but cannot guarantee later category movement.
Consecutive and Clustered Results
A cluster occurs when related results appear close together. Clusters attract attention because the human mind readily detects repetition and proximity.
Nevertheless, short clusters frequently occur in random records.
Consecutive Single Repetitions
Suppose the opening singles across five sessions are:
4, 4, 7, 4, 2
Digit 4 appears three times within five sessions, including one consecutive repeat. This sequence forms a clear short-term cluster.
However, the cluster may disappear when the sample expands to 50 or 100 sessions.
Neighbouring Digit Movement
Readers sometimes track movement from one digit to a neighbouring value, such as 3 followed by 4 or 8 followed by 9.
This pattern may look systematic, but many possible relationships exist. If someone searches for enough connections after results appear, at least one pattern will usually seem meaningful.
Defining a Cluster Before Counting
An objective analysis should define:
- How many appearances form a cluster
- How many sessions the cluster may cover
- Whether opening and closing positions remain separate
- Whether reversed jodis qualify
- Whether interrupted sequences count
Predetermined rules reduce selective interpretation.
Short-Term and Long-Term Trend Differences
A trend can change substantially when the analysis period changes. Therefore, every result summary should identify its timeframe.
A digit may dominate one week while remaining average across an entire year.
Short-Term Views
Short periods highlight immediate repetitions, gaps, and clusters. They provide a detailed picture of a small number of sessions.
However, they also contain greater random variation. One unusual sequence can strongly affect percentages and rankings.
Long-Term Views
Longer periods smooth some short-term fluctuations. Consequently, broad frequency distributions may appear more balanced.
Yet long-term records can also combine different schedules, missing sessions, formatting systems, or data-quality conditions. Readers must check consistency before merging them.
Rolling Windows
A rolling window analyses a fixed number of recent sessions, such as the latest 10, 30, or 50 results. When a new result enters, the oldest result leaves.
This method shows how historical summaries change over time. Still, it does not convert the rolling pattern into a dependable prediction.
Percentages, Counts, and Averages
Raw counts provide the simplest trend measure. Percentages become useful when comparing datasets of different sizes, while averages help summarise gaps or totals.
Each measure requires accurate interpretation.
Converting Counts Into Percentages
If digit 3 appears six times across 30 opening results, calculate:
- 6 divided by 30 equals 0.20
- 0.20 multiplied by 100 equals 20 percent
Therefore, digit 3 accounted for 20 percent of recorded opening singles in that sample.
Comparing Unequal Samples
Suppose one month contains 26 sessions and another contains 30. Comparing raw counts alone may create an unfair impression.
Percentages adjust for the difference in sample size. Nevertheless, readers should still report the actual counts because percentages can exaggerate small samples.
Using Average Gaps Carefully
To calculate an average closed gap, add all completed gaps and divide by their number.
However, an average does not create a schedule. Some gaps may fall well below it, while others extend far beyond it.
Common Errors in Trend Analysis
Even correct arithmetic can produce weak conclusions when the analytical method contains bias.
Several mistakes repeatedly affect DpBoss Matka historical summaries.
Choosing Data After Seeing Results
Selecting a convenient start date can create a desired trend. For example, beginning immediately before a cluster may make one digit appear unusually active.
Instead, use fixed calendar periods or predetermined session counts.
Ignoring Missing Sessions
Removing blank dates without marking them can make separate results appear consecutive. Moreover, unexplained missing records can alter frequency and gap calculations.
Every gap or closure should remain visible within the dataset.
Mixing Result Positions
Combining opening and closing singles may support a general summary, but it removes position-specific detail. Similarly, mixing opening and closing panels can obscure meaningful differences in the record structure.
Maintain separate fields before creating combined totals.
Rounding Too Early
Premature rounding can distort percentages and averages. Keep full values during calculations, then round only the displayed result.
For example, calculate all percentages from original counts rather than rounded intermediate figures.
Searching for Patterns Without Limits
A large dataset supports countless possible comparisons. Someone might examine reverses, totals, digit families, dates, weekdays, gaps, colours, or pair structures until an attractive pattern emerges.
This process increases false findings. Define the intended tests before examining the outcomes.
Cognitive Biases That Affect Interpretation
Human perception naturally searches for order. Consequently, readers may see intention or predictability in results generated by chance.
Recognising common biases encourages more disciplined analysis.
Confirmation Bias
Confirmation bias occurs when someone notices evidence supporting an existing belief while overlooking conflicting results.
A reader expecting digit 7 may remember its appearances and disregard the many sessions in which it failed to appear.
Recency Bias
Recent results often feel more important than older records. A jodi that appeared twice during the latest week may seem dominant, despite remaining rare across six months.
Comparing multiple timeframes can reveal this distortion.
Selection Bias
Selection bias arises when the dataset excludes inconvenient dates, markets, or outcomes. Consequently, the resulting trend does not represent the complete record.
Use consistent inclusion rules and document every omission.
Pattern Illusion
Pattern illusion makes random clusters appear purposeful. Repeated endings, alternating digits, and mirrored jodis can create a compelling visual sequence.
However, appearance alone cannot demonstrate a reliable relationship.
A Reliable Process for Reviewing Trends
A structured method improves accuracy and keeps observations separate from assumptions.
Use the following sequence when reviewing historical results:
- Define the exact question.
- Select a fixed date range.
- Arrange all records chronologically.
- Preserve blanks and closed sessions.
- Separate opening, jodi, and closing fields.
- Verify panel-to-single calculations.
- Standardise zeros and number formats.
- Count frequencies and completed gaps.
- Calculate percentages from full samples.
- Compare short and long periods.
- Record observations without predictive claims.
- Recheck the source data for errors.
Additionally, repeat calculations when a result appears unusual. A surprising trend may reflect a typing mistake rather than an authentic pattern.
Responsible Interpretation of Result Records
Historical data should serve as an informational record. It should not encourage claims of certainty, guaranteed returns, fixed formulas, or assured future selections.
Matka-related activity may also carry legal and financial consequences. Laws differ across locations, and some jurisdictions prohibit participation. Therefore, readers should check applicable rules before engaging in any related activity.
Financial limits remain equally important. Gambling funds should never come from rent, food, healthcare, education, debt payments, emergency savings, or other essential commitments. Moreover, attempting to recover losses through increased stakes can intensify harm.
Warning signs may include:
- Borrowing money to participate
- Hiding losses from family members
- Spending beyond planned limits
- Feeling unable to stop
- Chasing previous losses
- Neglecting work or responsibilities
Anyone facing these difficulties should stop participating and seek qualified support.
Conclusion
DPBoss Matka trends can organise historical information by revealing frequencies, repetitions, clusters, panel structures, and gaps. Accurate analysis requires clean records, fixed periods, consistent definitions, position-specific counts, and careful calculations. However, every visible pattern must remain within its proper historical context. Hot digits, cold jodis, repeated panels, and long absences cannot guarantee later outcomes. By separating measurable facts from predictive assumptions, readers can interpret result records more accurately, avoid common statistical errors, and maintain a responsible perspective on chance-based numerical activity.
FAQs
What are DPBoss Matka result trends?
DPBoss Matka result trends are recurring features noticed in historical records, such as digit frequencies, jodi repetitions, panel categories, and gaps between appearances. They describe how past results were distributed across a chosen period. However, they do not prove that similar movement will continue in later sessions.
Can frequent numbers predict the next result?
No. A frequently recorded number only shows what happened during the selected sample. It does not gain momentum or receive a higher chance merely because it appeared repeatedly. Similarly, a rarely recorded digit does not become due. Future results remain uncertain regardless of past frequency rankings.
Why should opening and closing digits remain separate?
Opening and closing digits occupy different positions within a complete result. Combining them can hide position-specific frequencies, gaps, and repetitions. Separate counts preserve the structure of the historical data. A combined total may still provide a broad summary, but readers should create it only after retaining the original fields.
What is the best period for checking a trend?
No single period suits every analysis. A week highlights immediate clusters, while several months provide a larger sample and reduce the influence of isolated runs. Comparing fixed short-term and long-term periods offers better context. Nevertheless, neither timeframe can produce certainty about a future result.
Does a long gap mean a number is due?
No. A long gap confirms only that a number has remained absent across the measured sessions. It does not force the number to appear next or within its previous maximum interval. Random sequences can exceed earlier gaps, averages, and expectations without violating any statistical principle.
How can readers avoid false patterns?
Readers should define categories and periods before checking results, include every valid session, preserve missing entries, separate opening and closing positions, and verify calculations. Moreover, they should compare apparent trends across larger samples. These controls reduce selective interpretation, although they cannot make historical patterns predictive.