
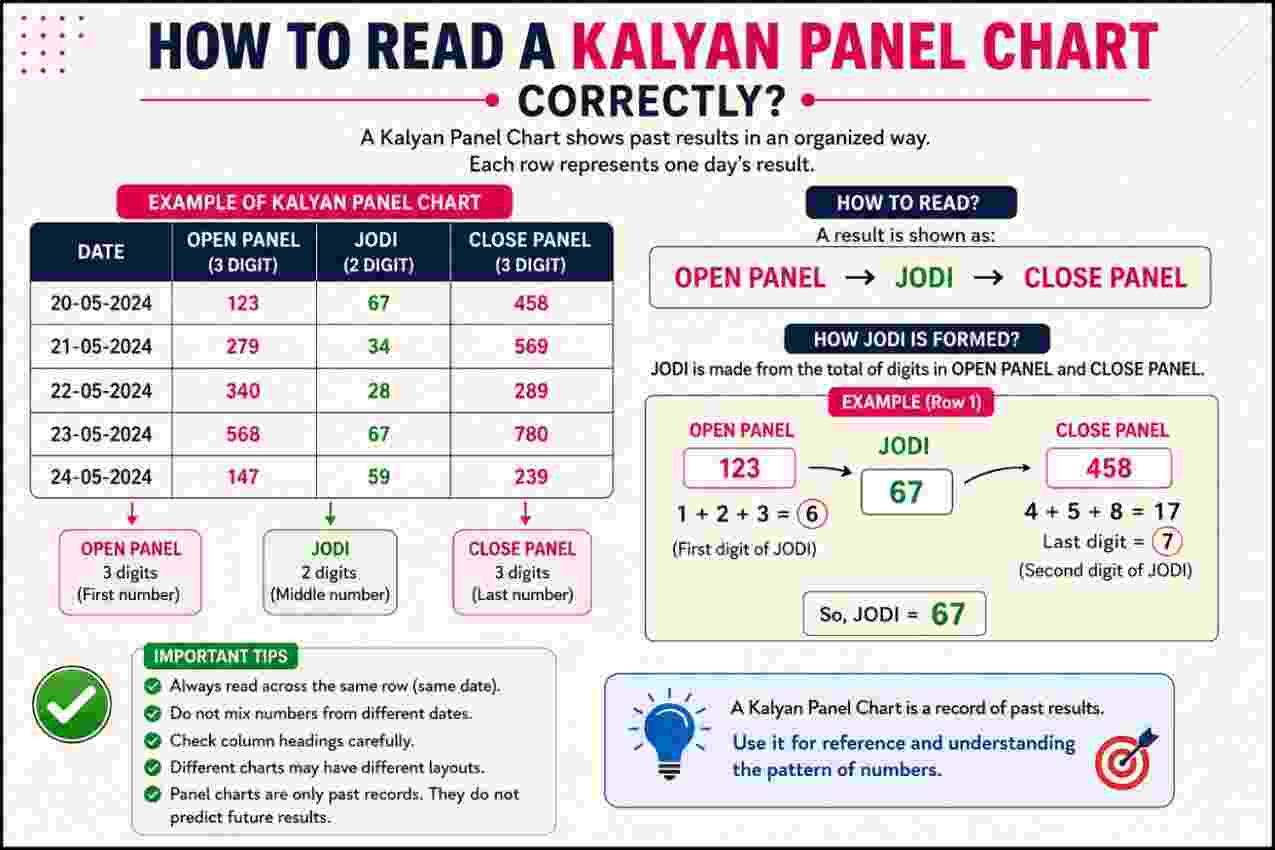
A Kalyan Panel Chart records past numerical results in a structured format. Although the layout may initially appear complicated, each row follows a consistent sequence involving dates, three-digit panels, single digits, and jodi pairs. Reading the chart correctly requires careful identification rather than prediction or guesswork. Readers must recognise how individual numbers connect, where each result appears, and how weekly records move across the page. Accurate reading also helps prevent common mistakes caused by reversed digits, missing dates, unclear symbols, or confusion between open and close results.
What Is a Kalyan Panel Chart?
A Kalyan Panel Chart presents historical Kalyan results arranged by date or week. It usually displays an opening panel, an opening digit, a jodi, a closing digit, and a closing panel. Therefore, every completed entry represents a connected result rather than several unrelated numbers.
Readers commonly use these records to check previously declared outcomes, compare entries, or maintain personal notes. However, records cannot establish what will happen in a future session. Each new outcome remains uncertain.
The Main Purpose of the Chart
The chart provides an organised archive of declared results. Instead of checking separate records for every day, readers can view multiple entries within one structured layout.
A chart can help readers:
- Verify a result against a specific date
- Distinguish opening and closing panels
- Locate the jodi associated with two single digits
- Review weekly or monthly records
- Identify missing, cancelled, or unavailable sessions
- Correct errors in independently maintained notes
Consequently, its main value lies in record organisation and result verification.
Why the Layout Can Look Confusing
Several numbers often appear close together, and each one performs a different role. Moreover, some charts arrange days horizontally, while others display them vertically. Decorative colours, compact fonts, and inconsistent spacing can create further confusion.
The chart becomes easier to read once the reader separates every entry into five components:
- Opening panel
- Opening digit
- Jodi
- Closing digit
- Closing panel
This sequence forms the foundation of accurate chart reading.
Key Parts of a Complete Result
Every complete result follows a defined numerical relationship. Readers should examine the opening side first, move to the central jodi, and then check the closing side.
Opening Panel
The opening panel consists of three digits. For example, a displayed opening panel might appear as 137. These three digits produce the opening single through a basic total.
Add the digits:
- 1 + 3 + 7 = 11
Only the final digit of the total matters. Therefore, the opening digit becomes 1.
If the total produces a single digit, that number remains unchanged. For instance:
- 1 + 2 + 3 = 6
In this case, the opening digit becomes 6.
Opening Digit
The opening digit represents the last digit of the opening panel’s sum. It appears as the first digit of the jodi.
Suppose the opening panel equals 246:
- 2 + 4 + 6 = 12
- The last digit of 12 is 2
- Therefore, the opening digit is 2
This calculation allows the reader to check whether the chart connects the panel and jodi correctly.
Closing Panel
The closing panel also contains three digits. However, it appears after the jodi and produces the second single digit.
Consider a closing panel of 580:
- 5 + 8 + 0 = 13
- The last digit is 3
- Therefore, the closing digit equals 3
Some layouts place the closing panel immediately beside the jodi. Others leave a visible space or use another column. Readers should confirm the heading order before interpreting any row.
Closing Digit
The closing digit comes from the final digit of the closing panel’s total. It forms the second digit of the jodi.
For example, if the closing panel is 349:
- 3 + 4 + 9 = 16
- The closing digit is 6
If the opening digit was 2, the completed jodi would appear as 26.
Jodi Result
A jodi combines the opening digit and closing digit in their declared order. The first digit always comes from the opening panel, while the second comes from the closing panel.
For example:
- Opening panel: 246
- Opening digit: 2
- Closing panel: 349
- Closing digit: 6
- Jodi: 26
Reversing the order would create 62, which represents a different pair. Therefore, readers must preserve the opening-to-closing sequence.
How the Digit Calculation Works
The calculation method remains consistent across normal entries. Readers add all three digits in a panel and retain only the final digit of the resulting total.
When the Total Has One Digit
A panel such as 124 produces a total of 7:
- 1 + 2 + 4 = 7
Since the result already contains one digit, the relevant single is 7. No further calculation is necessary.
When the Total Has Two Digits
A panel such as 589 produces a total of 22:
- 5 + 8 + 9 = 22
The final digit of 22 is 2. Consequently, the single digit becomes 2.
Readers should not repeatedly add the digits of 22. Doing so would produce 4, which would be incorrect for this chart-reading method.
When the Total Ends in Zero
Some panels produce totals ending in zero. For example:
- 1 + 2 + 7 = 10
- The final digit is 0
Therefore, the associated single equals 0. Zero holds the same importance as every other digit and should never be removed from a jodi.
If the closing digit equals 4, the completed jodi becomes 04, not 4. The leading zero preserves the pair’s two-digit format.
Reading One Complete Entry Step by Step
A systematic process reduces errors. Instead of interpreting the entire row at once, readers should confirm each part separately.
Assume an entry displays:
137 – 1 – 16 – 6 – 349
The exact visual arrangement may differ, but the underlying result follows the same relationship.
Step 1: Identify the Opening Panel
The first three-digit number is 137. Add its digits:
- 1 + 3 + 7 = 11
- The final digit is 1
Therefore, the opening digit should equal 1.
Step 2: Check the First Jodi Digit
The jodi appears as 16. Its first digit is 1, which matches the opening calculation. Consequently, the opening portion remains internally consistent.
Step 3: Identify the Closing Panel
The final three-digit number is 349. Add its digits:
- 3 + 4 + 9 = 16
- The final digit is 6
Therefore, the closing digit should equal 6.
Step 4: Check the Second Jodi Digit
The second digit of the jodi is 6. It matches the closing panel calculation, so the closing portion also remains consistent.
Step 5: Confirm the Full Sequence
The complete reading becomes:
- Opening panel: 137
- Opening digit: 1
- Jodi: 16
- Closing digit: 6
- Closing panel: 349
This method allows readers to verify the entry without relying solely on its visual presentation.
Recognising Different Chart Layouts
Not every Kalyan Panel Chart uses the same design. However, the underlying information usually remains similar. Readers should examine headings, date placement, and number grouping before interpreting results.
Weekly Horizontal Layout
A horizontal chart may show one week per row and individual days across several columns. Each cell normally contains the result for one session.
The row may begin with a starting date and ending date. Meanwhile, the columns may represent Monday through Saturday. A blank Sunday column may appear because regular sessions might not run on that day.
Readers should trace the correct row and column carefully. Moving one cell sideways can associate a result with the wrong date.
Vertical Date Layout
Some charts list individual dates from top to bottom. Each row contains one complete result, often divided into separate opening, jodi, and closing columns.
This format generally makes date verification easier. Nevertheless, readers must still check whether the first three-digit number represents the opening or closing panel.
Compact Combined Layout
A compact display may place both panels and the jodi inside one narrow cell. Line breaks, colours, or font sizes separate the components.
For example, a cell might show:
- 137
- 16
- 349
Here, the upper number indicates the opening panel, the middle pair indicates the jodi, and the lower number indicates the closing panel.
Colour-Coded Entries
Some charts use red, black, green, or blue text to mark particular result categories. However, colour conventions vary between publishers. A reader should never assume that one colour carries a universal meaning.
Always interpret the numbers through their position and calculation. Colour should provide secondary visual support, not primary evidence.
Matching Results With Correct Dates
Date alignment forms an essential part of accurate reading. Even a correctly interpreted result becomes useless when connected to the wrong session.
Check the Date Range First
Weekly charts often display a range rather than separate dates beside every cell. For example, a row might cover Monday, 3 August, through Saturday, 8 August.
Once the reader identifies the starting date, each following column advances by one day. Therefore, the third result in that row would normally correspond to Wednesday, 5 August.
Confirm the Day Sequence
A standard sequence may run from Monday to Saturday. However, special schedules, closures, or format changes can interrupt that pattern.
Readers should check for:
- Blank cells
- Dashes
- Holiday labels
- Cancelled-session symbols
- Separate open-only results
- Unusual date jumps
Moreover, a blank cell should not automatically shift every later result. It may simply indicate that no result appeared for that date.
Watch Month and Year Changes
A weekly row can cross from one month into another. Similarly, late-December records may continue into January of the following year.
Readers should examine the full date range instead of assuming that every day belongs to the month shown in a large heading. This precaution prevents mistakes when recording results near calendar boundaries.
Single, Jodi, and Panel Differences
These three result types remain connected, yet they represent different numerical forms.
Single
A single contains one digit from 0 through 9. It comes from the last digit of a panel total.
For instance, panel 489 produces:
- 4 + 8 + 9 = 21
- Single: 1
Both the opening and closing sides produce their own single.
Jodi
A jodi contains two digits. The opening single appears first, and the closing single appears second.
If the opening single equals 1 and the closing single equals 7, the jodi becomes 17. Therefore, 17 and 71 cannot be treated as interchangeable entries.
Panel
A panel contains three digits. In standard records, the digits commonly appear in ascending or repeated arrangements permitted by the result format.
Readers should copy the full panel exactly. Changing 128 to 182 changes both the recorded sequence and, potentially, its validity within the established format.
Common Panel Categories
Panel numbers may fall into several recognised structural groups. Knowing these categories helps readers identify what they see, although the category does not determine a future outcome.
Single-Panna Pattern
A single-panna pattern contains three different digits, such as 137 or 248. Each digit appears once.
The reader still calculates the associated single by adding all three digits and retaining the final digit of the total.
Double-Panna Pattern
A double-panna pattern contains one repeated digit, such as 113, 225, or 677. Two positions carry the same digit, while the remaining position contains another digit.
For example:
- 2 + 2 + 5 = 9
- Panel: 225
- Associated single: 9
The repeated digit must appear in the correct position when copying the panel.
Triple-Panna Pattern
A triple-panna pattern contains the same digit three times, such as 111, 444, or 999.
For example:
- 4 + 4 + 4 = 12
- Associated single: 2
Triple panels can look easy to record, yet readers should still confirm every digit and the connected single.
How to Verify Chart Accuracy
Errors can enter a chart through typing mistakes, unclear images, incorrect dates, or incomplete updates. Consequently, readers should perform several internal checks before accepting an entry.
Recalculate Both Panels
Add the opening panel digits and compare the final digit with the first jodi digit. Next, repeat the process for the closing panel and compare the result with the second jodi digit.
If either side fails to match, the entry may contain an error.
Check the Numerical Order
Confirm that the chart places the opening panel before the closing panel. Additionally, verify that the jodi follows the same opening-to-closing order.
A correct calculation can still produce an incorrect reading if someone reverses the two sides.
Inspect Adjacent Dates
Review the previous and following entries to ensure that the selected result belongs to the intended date. This check becomes especially useful in tightly packed weekly layouts.
Treat Missing Data Carefully
A dash, blank space, or symbol may indicate unavailable data, a closed session, or an incomplete update. Never invent a missing panel or infer it from nearby entries.
Frequent Reading Mistakes
Most errors arise from hurried reading rather than difficult arithmetic. A deliberate checking routine can prevent them.
Adding the Jodi Digits
The jodi does not require addition. It directly combines the opening and closing singles. Therefore, a jodi of 28 remains 28; it should not become 10 or 0.
Reducing a Total Twice
When a panel total equals 17, the associated single is 7. Adding 1 and 7 again to produce 8 applies the wrong method.
Only the final digit of the original three-digit panel total matters.
Dropping a Leading Zero
A pair such as 05 must remain 05. Writing it as 5 removes the two-digit structure and can create confusion with a single result.
Reading Panels Backward
A panel displayed as 128 should not become 821 or 182. Although reordered digits produce the same sum, the panel record itself requires the declared sequence.
Using Colour as the Main Clue
Colours may indicate categories, highlights, or design choices. Since no universal colour system applies to every chart, position and calculation provide more reliable evidence.
Confusing Historical Records With Forecasts
A Kalyan Panel Chart records previous outcomes. Patterns visible in historical data cannot confirm the next result. Consequently, readers should avoid treating repetition, gaps, or numerical frequency as a reliable prediction method.
A Practical Reading Checklist
A fixed checklist helps readers review charts consistently and avoid preventable mistakes.
Before recording any result:
- Locate the correct year and month.
- Find the relevant weekly row or individual date.
- Confirm the day column.
- Identify the opening panel.
- Add its three digits.
- Retain the final digit as the opening single.
- Compare it with the first jodi digit.
- Identify and calculate the closing panel.
- Compare its single with the second jodi digit.
- Copy both panels and the jodi exactly.
- Preserve every zero and repeated digit.
- Mark blank or cancelled sessions without assumptions.
Finally, reread the complete entry from left to right. This last check often catches reversed panels, incorrect dates, and transcription errors.
Responsible Use of Historical Charts
These charts should function as records, not promises of future outcomes. Numerical history can show what occurred, but it cannot remove chance from later results.
Readers should also recognise the financial and legal risks connected with gambling activity. Local laws may restrict or prohibit participation. Therefore, anyone reviewing historical information should follow applicable rules and avoid using money required for household expenses, debt payments, education, healthcare, or savings.
Moreover, chasing losses can increase financial harm. Setting firm limits, stopping when those limits are reached, and seeking appropriate support when gambling causes distress remain important protective measures.
Conclusion
Reading a Kalyan Panel Chart correctly requires careful attention to dates, panel order, digit totals, jodi placement, and missing entries. Start with the opening panel, retain the final digit of its sum, verify the first jodi digit, and repeat the process for the closing side. Moreover, preserve leading zeros, repeated digits, and the declared numerical sequence. A consistent checking method improves record accuracy and reduces avoidable confusion. Historical charts can confirm previous outcomes, but they cannot guarantee or reliably forecast future results.
FAQs
What does a Kalyan Panel Chart show?
A Kalyan Panel Chart displays historical opening panels, opening singles, jodi pairs, closing singles, and closing panels according to dates or weekly periods. Its structure helps readers verify declared records. However, it does not provide reliable proof of future numbers or remove the uncertainty associated with later outcomes.
How is a single digit calculated from a panel?
Add all three digits in the panel, then retain only the final digit of the total. For example, 4 + 5 + 8 equals 17, so the associated single is 7. Do not add 1 and 7 again, because that extra calculation produces an incorrect result.
Why does the order of Jodi digits matter?
The first Jodi digit comes from the opening panel, while the second comes from the closing panel. Reversing them creates a different pair. For example, an opening single of 2 and a closing single of 6 form 26, not 62. Accurate reading always preserves the declared sequence.
What does a blank space in the chart mean?
A blank space may indicate a closed session, unavailable information, a holiday, a cancelled result, or an incomplete update. The precise meaning depends on the chart’s notation. Readers should not insert an assumed number or shift surrounding entries unless the displayed dates clearly support that action.
Can historical panel results predict a future result?
No historical record can reliably predict a future result. Repeated panels, missing digits, frequency counts, and visible sequences may appear meaningful, but chance can produce such patterns naturally. A chart supports record checking and organisation; it does not offer certainty, guaranteed selection, or a dependable forecasting system.