
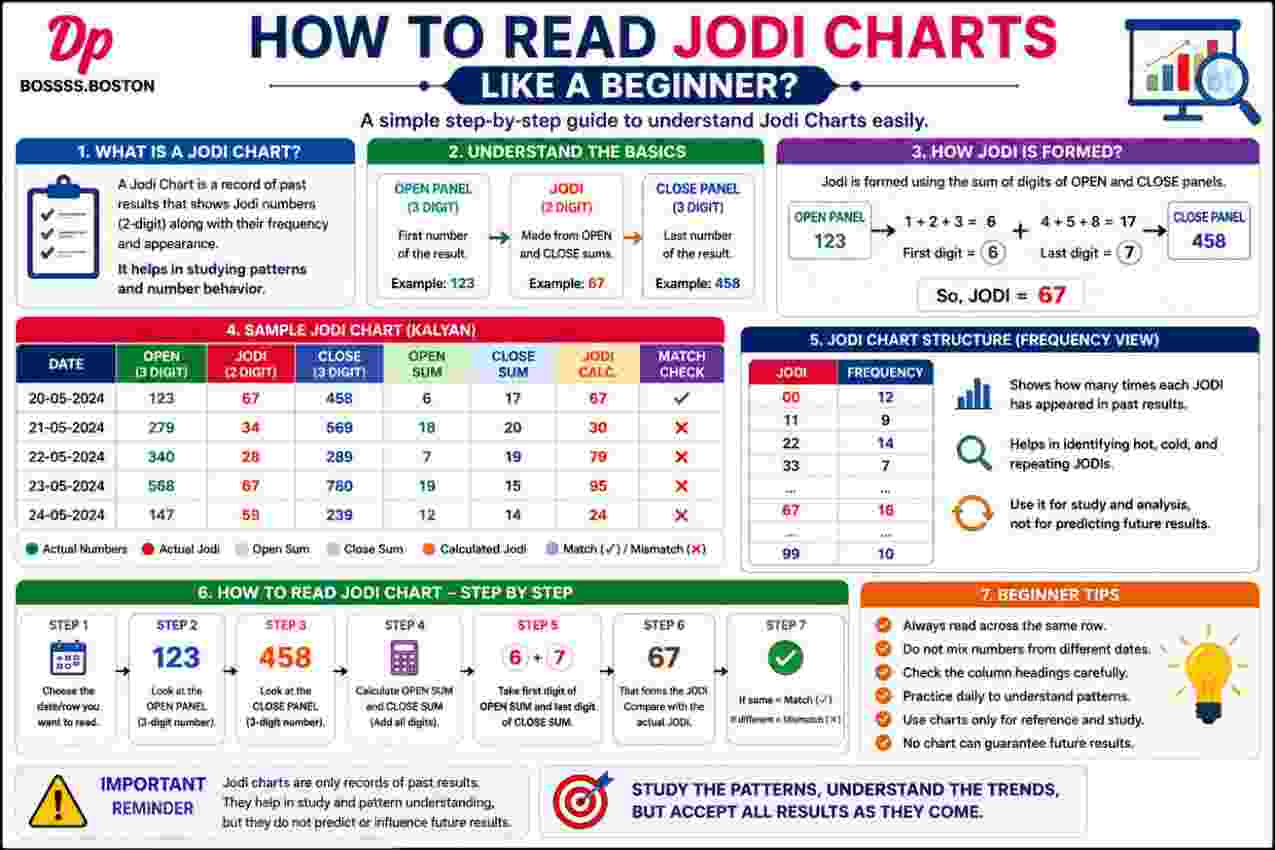
Jodi charts arrange historical two-digit results by date, helping readers locate and compare older records within a consistent grid. Their compact appearance may seem confusing because rows, columns, date ranges, and repeated numbers often sit close together. However, beginners can read them accurately by following a fixed sequence. Start with the chart title, confirm the year and month, identify the date, and then locate the corresponding two-digit entry. Careful alignment and basic verification prevent most reading errors. Historical charts record completed outcomes only; they cannot establish certainty about future results.
What Is a Jodi Chart?
A Jodi chart is a chronological record of two-digit results. The word “Jodi” refers to a pair, so every completed entry usually contains two positions. The first position represents an opening digit, while the second represents a closing digit.
For example, 47 contains an opening digit of 4 and a closing digit of 7. Reversing the order creates 74, which represents a different pair. Therefore, digit order always matters.
The Basic Information Shown
Most charts contain several connected elements:
- A chart or market heading
- A year label
- Monthly divisions
- Weekly date ranges
- Individual weekday positions
- Two-digit historical results
- Blank or closed-session markers
Some layouts place dates vertically, whereas others arrange weekly periods in horizontal rows. Nevertheless, the date and pair must remain connected.
Why Charts Use a Grid
A grid gives each date and result a fixed location. Rows commonly represent weeks, while columns represent operating days. Alternatively, every row may represent one individual date.
This structure allows readers to scan older information without reviewing an unorganised list. Moreover, repeated formatting makes comparisons easier because the same weekday or data category remains in a consistent position.
Know the Meaning of a Jodi
Before reading a full chart, recognise how a two-digit pair works. A Jodi always requires two ordered positions.
If the result displays 06, the opening digit is 0 and the closing digit is 6. Removing the leading zero changes the format and may confuse. Similarly, 60 does not carry the same record as 06.
Opening and Closing Positions
Each pair follows this order:
- The first digit represents the opening position.
- The second digit represents the closing position.
Consider the pair 29. The opening position contains 2, while the closing position contains 9. Consequently, a reader should never interpret 29 as 92.
Possible Pair Range
Two-digit pairs can appear from 00 through 99. This format creates one hundred ordered combinations when leading zeroes remain visible.
The full range includes:
- Double-digit pairs such as 11, 44, and 88
- Mixed pairs such as 17, 53, and 90
- Leading-zero pairs such as 02, 06, and 09
- Zero-ending pairs such as 10, 40, and 70
Understanding this format helps beginners distinguish complete pairs from single digits or date numbers.
Step 1: Check the Chart Heading
Begin with the heading displayed above the grid. It identifies which historical record the chart covers.
Different records may use similar layouts and date ranges. Therefore, selecting the correct heading prevents readers from consulting an unrelated dataset.
Confirm the Record Type
Look for wording that identifies the chart as a Jodi record rather than a panel, single-digit, or mixed-format chart.
A Jodi chart should primarily display two-digit entries. In contrast, a panel chart often contains three-digit groups alongside opening and closing information.
Avoid Confusing Similar Charts
Two charts may cover identical years yet contain different records. Do not rely on colours or layout alone because many designs use similar visual styles.
Instead, verify:
- The heading
- The displayed data format
- The relevant year
- The required date range
- The presence of two-digit pairs
Only continue after confirming these details.
Step 2: Identify the Date Direction
Next, determine how time progresses across the chart. Date direction provides the foundation for every later step.
Some charts move downward week by week. Others move horizontally across days before continuing on the next line.
Vertical Date Layouts
A vertical layout usually places individual dates in the left column. Each result appears in the same horizontal row as its date.
To read this layout:
- Find the required date.
- Keep your eye on that row.
- Move horizontally to the result column.
- Read the two-digit entry.
- Return to the date for confirmation.
This design often provides the simplest reading experience for beginners.
Weekly Row Layouts
A weekly chart may place a starting and ending date at the left side of each row. Separate columns then represent days within that week.
For instance, a row might cover Monday through Saturday. The first result belongs to Monday, the second to Tuesday, and the sequence continues across the row.
Therefore, readers must identify both the correct week and the correct weekday column.
Step 3: Confirm the Year
Long historical charts may store records from several years. A date without a visible year can lead to major errors because the same day and month recur annually.
Always identify the correct annual section before inspecting individual pairs.
Where Year Labels May Appear
The year may appear:
- Above the entire chart
- Beside a monthly heading
- Within a navigation menu
- At the beginning of each section
- Inside every complete date
- On a separate annual page
If the year remains unclear, inspect neighbouring date ranges. However, do not assume the period from the position of a result alone.
Why the Year Matters
An identical pair may appear on the same calendar date in different years. Without the year, readers cannot separate these occurrences accurately.
Moreover, charts sometimes display annual records in reverse order, placing newer years first. Confirming the label prevents accidental use of the closest visible section.
Step 4: Locate the Correct Month
After confirming the year, move to the relevant month. Most lengthy charts divide annual data into monthly sections, making navigation faster.
Month headings may appear as full names, abbreviations, or numbers. Consequently, readers should check the chart’s date convention.
Recognise Monthly Boundaries
A monthly boundary may use:
- A bold heading
- A coloured divider
- A thick horizontal border
- Additional spacing
- A separate page or tab
- An expandable digital section
These boundaries prevent the final week of one month from blending with the first week of the next.
Watch for Weeks Crossing Two Months
One weekly row may begin near the end of one month and finish during the next. For example, a row could start on 29 June and end on 4 July.
In that situation, verify each weekday’s actual date. Do not assign every cell to the month shown at the beginning of the row.
Step 5: Find the Required Week
Once the month becomes clear, locate the weekly range that contains the target date. This step narrows the search to one row.
The date range may appear as two separate dates or a shortened expression. For example, “05–10” may cover six operating days within the same month.
Check Both Range Boundaries
Read the starting and ending dates carefully. A target date belongs to the row only when it falls inside that range.
Additionally, confirm whether the chart includes Sundays. Many weekly grids cover six operating days, while others include all seven calendar days.
Count Weekday Positions Carefully
After identifying the correct row, count across the weekday columns. Start from the day indicated by the first header rather than automatically assuming Monday.
A chart may begin with:
- Monday
- Sunday
- Another operating day
- A date-specific starting position
Column headers provide the safest source of direction.
Step 6: Locate the Exact Day
Now identify the column representing the target date. Match the weekday with the weekly range before reading the pair.
This step deserves close attention because choosing the right week but the wrong column still produces an incorrect result.
Use Headers Instead of Guessing
Headers may use full weekday names or abbreviations such as Mon, Tue, Wed, Thu, Fri, and Sat. Follow these labels directly.
If no weekday headers appear, calculate each position from the range’s starting date. Then, verify the sequence against the next row.
Handle Closed Days Correctly
A closed day may appear as:
- A blank cell
- A dash
- A cross
- A closure label
- Another defined symbol
Do not move to the next visible result and assign it to the closed date. Every cell retains its original date position, even when it contains no number.
Step 7: Read the Two-Digit Result
After finding the correct cell, read the two digits from left to right. Keep the pair intact and preserve its order.
For example, read 38 as thirty-eight in display form, with an opening digit of 3 and a closing digit of 8. Do not separate it into unrelated values.
Preserve Leading Zeroes
Pairs from 00 through 09 require a visible zero in the first position. Thus, 07 must remain 07 rather than 7.
A missing leading zero creates three problems:
- It removes the two-position structure.
- It can look like a single-digit result.
- It may cause errors during sorting or comparison.
- It can change spreadsheet formatting.
Therefore, copy every pair exactly as displayed.
Distinguish Pairs From Dates
Dates and results may both contain two digits. Their positions reveal their roles.
A date usually appears in a labelled date column or weekly range. Meanwhile, a pair occupies a result cell beneath a weekday heading. Check the grid before treating any two-digit number as a Jodi entry.
Step 8: Separate the Opening and Closing Digits
Once the pair is clear, divide it mentally into two positions. This separation helps readers interpret the structure without changing the original entry.
For a pair of 52:
- Opening digit: 5
- Closing digit: 2
- Complete pair: 52
The opening and closing positions remain connected through the complete pair.
Why Position Matters
The same two digits can create two different results depending on their order. For example:
- 16 has an opening digit of 1 and closing digit of 6.
- 61 has an opening digit of 6 and closing digit of 1.
Therefore, visual similarity does not make the two pairs interchangeable.
Read Double Pairs Correctly
Double pairs use the same digit in both positions, such as 00, 22, 55, or 99. They still contain two positions and should not become single digits.
For instance, 44 represents an opening digit of 4 and a closing digit of 4. Both positions remain necessary.
Step 9: Verify the Pair Against Its Date
After reading the result, trace the cell back to the date. This final alignment check catches many common mistakes.
Dense grids can cause the eye to shift into a neighbouring row or column, particularly on small screens.
Use a Three-Point Check
Confirm three details:
- The weekly row contains the required date.
- The weekday column matches that date.
- The pair appears at the intersection of that row and column.
When all three points align, the historical entry has the correct date connection.
Repeat the Reading Path
Return to the start of the row and repeat the path slowly. Begin with the date range, move to the weekday, and finish at the pair.
If the second reading produces a different result, inspect the grid more closely before recording either value.
Step 10: Record the Entry Clearly
If the information requires transcription, use a consistent format. A stable structure prevents dates and pairs from becoming separated later.
A simple record may contain:
- Full date
- Weekday
- Two-digit pair
- Opening digit
- Closing digit
- Note for closures or unavailable data
Use a Full Date
Write the day, month, and year whenever possible. A shortened date may become unclear once removed from the original monthly section.
For example, “08 August 2025 — 47” carries more context than “08 — 47.”
Protect Automatic Formatting
Spreadsheet software may remove leading zeroes or convert entries into dates. Store pairs as text when necessary so 04 remains 04.
Similarly, check whether a date such as 10-11 has changed into an unintended format. A quick review after data entry protects the original record.
How to Read a Simple Example
Consider a weekly row that covers 4 August through 9 August. Assume the columns represent Monday through Saturday, and the displayed pairs appear in this order:
18, 42, 07, 63, 55, and 90.
The reading process follows the row and weekday positions.
Finding Wednesday’s Entry
If 4 August falls on Monday, then:
- Monday, 4 August: 18
- Tuesday, 5 August: 42
- Wednesday, 6 August: 07
- Thursday, 7 August: 63
- Friday, 8 August: 55
- Saturday, 9 August: 90
Therefore, Wednesday’s pair is 07. Its opening digit is 0, and its closing digit is 7.
Finding Friday’s Entry
Friday occupies the fifth position in this layout. The corresponding pair is 55.
Since both digits match, the opening digit and closing digit are both 5. Nevertheless, the complete entry remains 55 rather than a single 5.
Why the Example Works
The date range identifies the correct row, while weekday headers identify the correct column. The intersection produces the required pair.
This method works across larger charts because each search follows the same narrowing sequence: year, month, week, day, and result.
Differences Between Jodi and Panel Charts
Beginners sometimes confuse Jodi charts with panel charts because both formats contain historical numbers. However, they organise different types of entries.
Recognising the difference prevents readers from selecting three-digit panels when they need two-digit pairs.
Jodi Chart Format
A Jodi chart primarily displays two-digit values such as:
- 03
- 27
- 46
- 71
- 99
Its main purpose involves arranging pairs by date.
Panel Chart Format
A panel chart usually displays three-digit opening and closing groups, often with a pair between them. A complete line may resemble:
137 — 14 — 569
Here, 137 represents the opening panel, 14 represents the pair, and 569 represents the closing panel.
Choosing the Correct Record
Use a Jodi chart when the task involves locating a two-digit historical pair. Use a panel chart when the task requires full opening and closing panel information.
However, always verify the heading because some layouts display both formats within connected sections.
Reading Dpboss Matka Records Responsibly
Dpboss Matka searches may lead readers to large historical grids covering several periods and record types. The same basic reading process applies: confirm the heading, establish the date, identify the correct cell, and preserve the pair’s digit order.
Historical records support organised review, yet they do not provide guaranteed information about future outcomes.
Treat History as Recorded Data
A chart shows what entered the archive on previous dates. It can help readers locate repeated pairs or compare different periods.
However, repetition does not prove that a pair will appear again within a particular session. Each historical occurrence remains tied to its original date.
Avoid Claims of Certainty
No sequence, frequency count, colour highlight, or repeated digit can guarantee an unrecorded result. A chart cannot control future events simply because it stores previous entries.
Consequently, readers should separate factual historical retrieval from assumptions about what may happen later.
How to Read Repeated Pairs
Repeated values naturally appear in long archives. A pair such as 24 may occur on several unrelated dates.
The chart should preserve every occurrence separately because each one carries its own historical context.
Keep Every Occurrence Attached to Its Date
Do not combine repeated pairs into one general entry. Instead, record each date individually.
For example:
- 6 January: 24
- 18 March: 24
- 11 September: 24
These represent three separate historical occurrences, even though the pair matches.
Avoid Treating Frequency as Proof
A frequently displayed pair remains a historical observation. Its earlier appearances do not establish a reliable schedule for another appearance.
Similarly, a pair that has not appeared for a long period does not become certain or overdue. Historical gaps describe the archive, not a guaranteed future event.
How to Handle Missing or Unclear Information
Charts sometimes contain unreadable digits, damaged formatting, or unexplained gaps. Accurate reading requires readers to recognise uncertainty rather than invent missing details.
If a number appears unclear, check the surrounding structure before recording it.
Inspect the Original Cell
Enlarge the display, rotate a mobile screen, or review a clearer section of the chart. Similar-looking digits may become easier to distinguish at a larger size.
Common visual confusions include:
- 1 and 7
- 3 and 8
- 5 and 6
- 0 and 8
- 6 and 9
Typography and low image quality can increase these problems.
Mark Unverified Entries
If the value remains unclear, mark it as unverified. Do not choose the most likely digit based on neighbouring records because adjacent results do not confirm the missing entry.
An honest uncertainty marker protects the archive more effectively than an unsupported guess.
Common Beginner Mistakes
Beginners often make mistakes because they focus on visible pairs before confirming the date structure. A consistent reading sequence prevents most errors.
Selecting the Wrong Monthly Section
Matching dates appear every year, and similar weekly ranges appear across different months. Always verify the year and month first.
Moving Into the Wrong Column
A reader may locate the correct week but select Tuesday’s result instead of Wednesday’s. Follow the weekday header down to the chosen row.
Reversing the Pair
Pairs such as 26 and 62 contain the same digits but different positions. Read every result from left to right.
Removing the Leading Zero
A value such as 08 must retain both positions. Writing 8 changes the displayed format and hides the opening zero.
Treating Blank Cells as Zero
Blank does not equal 0 or 00. It may indicate closure, missing information, or a date outside the relevant range.
Mixing Jodi and Panel Values
Two-digit pairs and three-digit panels serve different roles. Confirm the chart type before copying a result.
A Quick Verification Checklist
Before accepting a historical entry, review the entire reading path. This short check supports greater accuracy across both simple and dense layouts.
Confirm that:
- The chart heading matches the required record.
- The year is correct.
- The month is correct.
- The weekly range contains the target date.
- The weekday column matches the date.
- The cell contains a two-digit pair.
- The digit order remains unchanged.
- Any leading zero remains present.
- Blank cells carry no assumed value.
- The copied record matches the chart.
If one point remains uncertain, repeat the search from the heading rather than adjusting the result from memory.
Conclusion
Beginners can read Jodi charts accurately by following a fixed order: identify the heading, confirm the year and month, locate the weekly range, choose the correct weekday, and read the pair from left to right. Leading zeroes, blank cells, and repeated values require particular care. Moreover, every result must remain connected to its full date. Dpboss Matka historical records become easier to review when readers verify row-and-column alignment before copying information. The chart documents completed results; it does not guarantee future numerical outcomes.
FAQs
What should a beginner check first in a Jodi chart?
A beginner should first confirm the chart heading, year, month, and date direction. These elements reveal which historical record the grid contains and how time moves through it. Afterward, the reader can locate the correct weekly row and weekday column before reading the two-digit pair.
How can a reader identify the opening and closing digits?
The first position of a two-digit pair represents the opening digit, while the second position represents the closing digit. For example, 38 contains an opening digit of 3 and a closing digit of 8. Reversing the positions creates a separate pair and changes the historical entry.
Why must a leading zero remain visible?
A leading zero preserves the pair’s two-position format. The entry 06 contains an opening digit of 0 and a closing digit of 6. Writing only 6 makes the value look like a single digit and may cause sorting, copying, or comparison errors.
What does a blank cell mean in a Jodi chart?
A blank cell may indicate a closed session, missing information, or a date outside the displayed period. Its precise meaning depends on the chart’s formatting convention. Readers should check nearby notes and avoid treating the blank as zero or moving another result into that position.
How can readers avoid choosing the wrong weekday result?
Readers should locate the correct weekly range and then trace the weekday header down to the relevant cell. Next, they should confirm that the target date falls at that row-and-column intersection. Repeating the path from the date range to the pair helps catch alignment mistakes.
Can repeated Jodi results confirm future outcomes?
No. Repeated pairs show that matching results appeared on separate historical dates. They do not establish when or whether the same pair will appear again. Jodi charts support accurate record retrieval and comparison, but previous sequences cannot guarantee an outcome that has not yet entered the archive.