
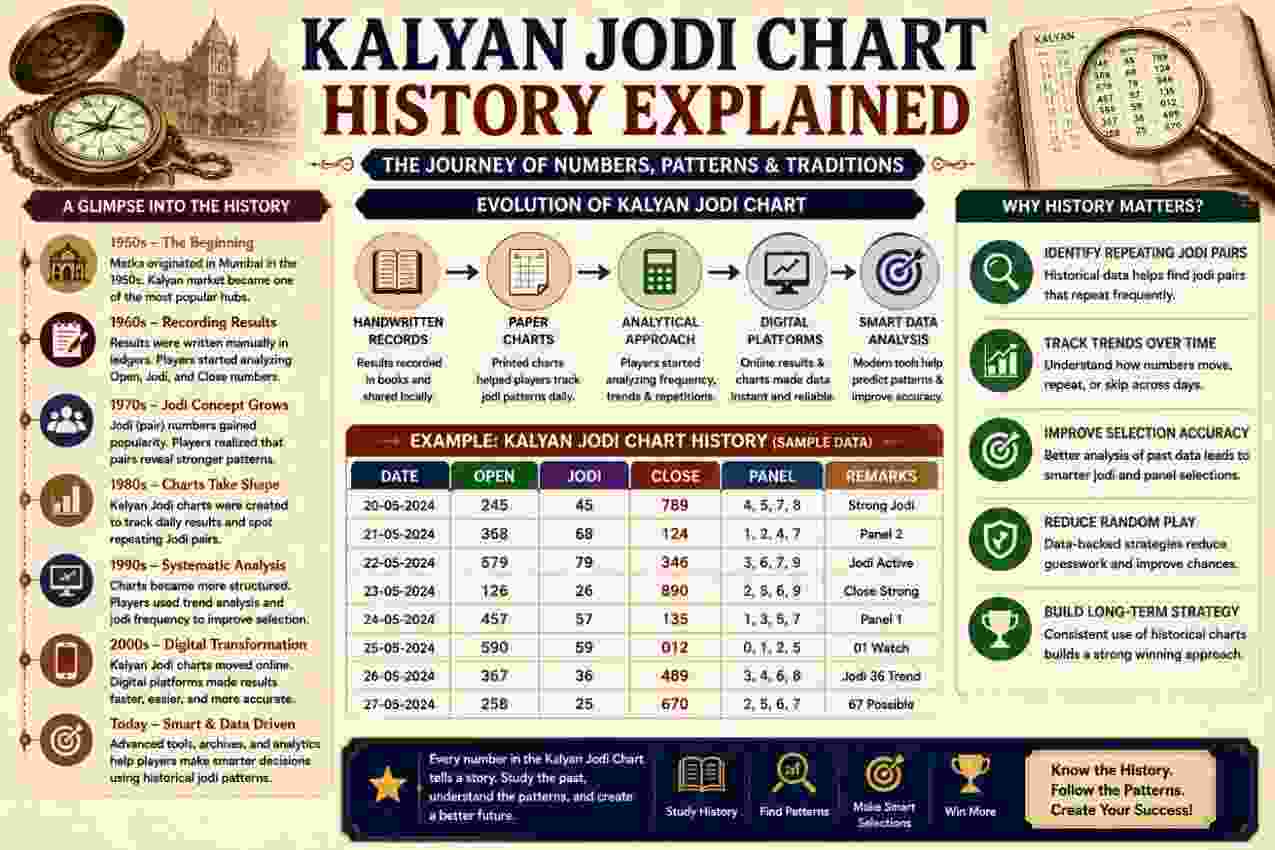
The Kalyan Jodi Chart presents past two-digit results from the Kalyan market in an organized historical format. Readers often examine these records to identify dates, compare previous outcomes, and interpret how jodi values appear over time. However, a historical chart records completed events rather than predicting future numbers. Its real value lies in orderly recordkeeping, data comparison, and result verification. Knowing its history, structure, and limitations helps readers interpret entries accurately while avoiding assumptions based on coincidence, repetition, or incomplete records.
What Is a Kalyan Jodi Chart?
A Kalyan Jodi Chart is a chronological record of two-digit values associated with completed Kalyan result sessions. Each jodi usually combines the final digit derived from the opening side with the final digit derived from the closing side. Consequently, the chart displays a compact result that readers can scan more easily than full panel records.
Meaning of a Jodi
A jodi consists of two digits written together. The first digit represents the opening result, while the second represents the closing result. For example, an opening digit of 4 and a closing digit of 7 create the jodi 47.
The order matters because 47 and 74 represent different outcomes. Therefore, readers should never reverse digits when checking an entry. Although both combinations use the same numbers, their positions communicate separate opening and closing values.
Purpose of the Chart
The chart primarily preserves completed results. It allows readers to check whether a particular jodi appeared on a given date, compare weekly records, and review older sequences without examining scattered daily updates.
Moreover, a properly arranged chart can support:
- Historical result verification
- Date-based comparison
- Weekly record review
- Detection of missing entries
- Correction of transcription errors
- Separation of opening and closing digits
Nevertheless, the chart does not provide certainty about later results. Every entry belongs to a completed session and carries no guaranteed connection with a future outcome.
How Kalyan Jodi Records Developed
Kalyan records did not always appear in the structured digital formats commonly used now. Earlier recordkeeping depended heavily on handwritten notes, printed sheets, local registers, and manually maintained tables. As record collections grew, organizers needed clearer methods for arranging dates and results.
Early Handwritten Records
During the earlier period, participants and recordkeepers commonly wrote daily results in notebooks. A typical entry contained the date, opening panel, opening digit, closing panel, and closing digit. The final jodi then appeared beside those details.
However, handwritten records created several problems. Poor handwriting could change one digit into another, pages could become damaged, and missing dates were difficult to trace. Additionally, different people sometimes used different layouts, making comparisons slow and confusing.
Even so, those notebooks established the basic historical practice of preserving results by date. The focus remained simple: record a completed outcome so readers could check it later.
Printed Weekly and Monthly Formats
As the volume of historical data increased, printed charts offered a more organized alternative. Weekly rows and monthly sections allowed users to locate older results with less effort. Similarly, fixed columns reduced confusion about where opening and closing information belonged.
Printed sheets usually followed a recurring sequence of working days. Each row represented a week, while each column represented a specific day. Consequently, readers could move horizontally to compare one week or vertically to review the same weekday across several weeks.
Yet printed records still required manual updates. A single typing or copying error could remain in circulation for a long period. Therefore, careful cross-checking remained essential.
Shift to Digital Archives
Digital formatting made historical records easier to store, search, and update. Large collections could cover several months or years without requiring physical storage. Moreover, readers could locate particular dates faster and compare separate periods on one screen.
Digital archives also introduced clearer spacing, color distinctions, and responsive layouts. Nevertheless, digitization did not automatically guarantee accuracy. Many online tables originated from older handwritten or printed sources, so transcription mistakes could pass into newer versions.
For that reason, historical consistency depends on accurate source material, careful data entry, and regular review. A polished layout cannot correct an incorrect original value.
How the Chart Is Structured
Although layouts vary, most charts use dates, weekdays, weekly rows, and two-digit results. Some records also include full panels, while others display only jodi values. Recognizing each component prevents readers from confusing a jodi with a panel or single digit.
Date and Day Arrangement
Many charts arrange days across the top and weeks down the left side. Another format places dates vertically, with one result beside each date. Both structures serve the same purpose, but the reading direction changes.
Before reviewing numbers, readers should confirm:
- The year covered by the chart
- The month or date range
- The order of weekdays
- Whether holidays appear as blank spaces
- Whether entries run horizontally or vertically
This initial check prevents a reader from connecting a result with the wrong date. Meanwhile, clear labels make long historical tables considerably easier to interpret.
Opening and Closing Digits
The opening digit occupies the first position in a jodi, while the closing digit occupies the second. These digits may derive from separate three-digit panels, depending on the displayed format.
For instance, if an opening panel produces a final digit of 3 and a closing panel produces a final digit of 8, the recorded jodi becomes 38. In contrast, a result of 83 would require an opening digit of 8 and a closing digit of 3.
Therefore, the positions cannot be exchanged. Correct interpretation always follows the stated opening-to-closing sequence.
Blank Spaces and Closed Days
A blank cell does not automatically represent zero. Instead, it may indicate a closed session, holiday, unavailable record, postponed update, or missing historical data. Some charts use symbols, dashes, or abbreviations to distinguish these situations.
Readers should check the chart’s stated conventions before interpreting a space. Otherwise, they may treat missing information as a completed result. Additionally, a zero jodi, such as 00 or 40, must appear explicitly because zero remains a valid digit within the format.
How a Jodi Result Is Formed
The jodi appears simple because it contains only two digits. However, full records may show how each digit derives from an opening or closing panel. This relationship explains why jodi tables and panel tables contain different levels of detail.
Deriving the Opening Digit
A three-digit opening panel may be added together, with the final digit of the total becoming the opening digit. For example, the digits 1, 4, and 8 total 13. The last digit of 13 is 3, so the opening digit becomes 3.
Similarly, a panel of 2, 5, and 7 totals 14, producing an opening digit of 4. The calculation retains only the final digit rather than the complete sum.
Deriving the Closing Digit
The closing digit follows the same basic calculation. Suppose the closing panel contains 3, 6, and 9. Their total equals 18, so the closing digit becomes 8.
When paired with an opening digit of 3, the final jodi becomes 38. Consequently, the chart may show only 38 even though a fuller record contains both three-digit panels.
Why Full Panels Matter
A jodi-only record offers speed and simplicity, while a full panel chart provides more context. If two sources display conflicting jodis, the associated panels can help verify which value follows the calculation correctly.
However, not every archive preserves full panel information. Older records may contain only final two-digit outcomes. In such cases, readers can verify consistency across multiple records, but they cannot reconstruct missing panels with certainty.
Reading Historical Entries Correctly
Accurate reading requires more than locating a familiar number. Readers must connect each result with its exact date, weekday, and chart period. They should also distinguish verified entries from blank, corrected, or incomplete cells.
Start With the Date Range
First, confirm the year and month shown. Charts from different years can display similar weekly arrangements, particularly when dates fall near the same weekdays. Consequently, skipping the year label can produce an incorrect comparison.
Next, locate the relevant week before moving to the weekday column. This two-stage approach reduces accidental row shifting, especially in wide tables.
Follow Rows and Columns Carefully
Long charts can cause the eye to move into an adjacent row. To avoid this issue, trace the selected week horizontally and verify the date label twice. Similarly, readers using a vertical format should follow one date line without jumping to the next result.
Mobile screens may compress columns or require sideways scrolling. Therefore, readers should ensure that the date column remains aligned with the selected result.
Check Corrections and Symbols
Some archives mark revised results with an asterisk, different color, or note. Others replace an incorrect number without showing the earlier entry. Readers should check whether the chart contains a correction key or update notice.
Moreover, decorative colors should not be mistaken for statistical signals. Designers often use color simply to separate rows, highlight weekends, or improve readability.
Why People Examine Chart History
Historical charts attract attention because they turn scattered daily outcomes into one continuous record. Readers can inspect frequency, repetition, gaps, and sequences at a glance. Still, visual patterns require cautious interpretation because random records naturally contain clusters.
Checking Previous Results
The most direct use involves confirming a completed result. A reader may remember one digit but need to verify the full jodi or exact date. The Kalyan Jodi Chart provides a central record for that purpose.
Older entries also help resolve disagreements caused by delayed messages or copying mistakes. However, confirmation works best when readers compare reliable records instead of accepting the first table they encounter.
Studying Frequency
Some readers count how often a particular jodi appears during a chosen period. Frequency analysis can describe the past accurately when the dataset contains complete entries. For instance, it can show that one value appeared four times within a year.
However, frequency does not establish what must occur next. A jodi that appeared often can stop appearing, while an absent value can return without warning. Historical counts remain descriptive, not predictive.
Observing Repetitions
Repeated values often draw attention because they look unusual. Yet repetition can occur naturally within any long series of two-digit outcomes. Adjacent repeats, weekly repeats, and mirrored combinations may all appear without forming a dependable rule.
Consequently, readers should separate visual interest from statistical evidence. A striking sequence may describe what happened, but it cannot promise continuation.
Common Historical Patterns
A long chart may display recurring jodis, mirrored values, doubles, and intervals between appearances. These features make the data visually engaging, although they do not control future results.
Double Jodis
Double jodis contain identical digits, such as 11, 22, 55, or 88. Because they have a symmetrical appearance, readers often notice them faster than mixed combinations.
Nevertheless, a double carries no special historical power merely because its digits match. Its presence records one completed outcome. Similarly, a long absence does not make a double due or overdue.
Mirror and Reverse Pairs
Reverse pairs use the same digits in opposite positions, such as 24 and 42. Readers sometimes connect these values across consecutive days or weeks. While the comparison can support record classification, the reversed form represents a separate jodi.
The opening and closing positions create that distinction. Therefore, 24 should never be counted as another appearance of 42.
Gaps Between Appearances
A gap measures the number of sessions between two appearances of the same jodi. Researchers can calculate short, long, or average historical gaps from a complete dataset.
However, an average does not create a schedule. If a value previously returned after ten sessions, it does not need to follow that interval again. Each gap simply summarizes past spacing.
Errors That Affect Historical Charts
Historical accuracy can suffer when people copy, format, or transfer records incorrectly. Even one wrong digit may affect frequency counts, gap calculations, and date comparisons. Therefore, readers should recognize common error sources.
Transcription Mistakes
A typist may enter 68 instead of 86, replace 3 with 8, or assign a result to the wrong row. These errors become harder to notice when the incorrect value still resembles a valid jodi.
Comparing the entry with full panel information can reveal some mistakes. Additionally, checking another independently maintained record may expose inconsistencies.
Misaligned Dates
Date alignment errors occur when a closed day shifts later values into neighboring columns. Likewise, a missing cell can cause every subsequent result in that row to appear under the wrong weekday.
A reliable layout preserves blank spaces rather than compressing the row. Consequently, visual alignment remains as important as numerical accuracy.
Incomplete Archives
Older charts may contain missing weeks, damaged records, or unclear digits. Readers should treat those gaps as unavailable information instead of filling them through assumptions.
Reconstructed entries require solid supporting evidence. Without it, adding a plausible number weakens the integrity of the entire historical record.
Responsible Interpretation of Chart Data
The Kalyan Jodi Chart can support organized historical review, but it cannot remove uncertainty from future outcomes. Responsible interpretation requires clear boundaries between recorded facts, observations, and unsupported predictions.
History Does Not Guarantee Prediction
Past frequency, repetition, symmetry, and gaps cannot guarantee a later jodi. A chart may show tendencies within a selected period, yet those tendencies can change immediately.
Therefore, statements that describe a number as fixed, certain, or guaranteed conflict with the nature of historical data. No visible sequence creates assurance.
Avoid the Gambler’s Fallacy
The gambler’s fallacy occurs when someone assumes that a value becomes more likely because it has not appeared for a long time. The opposite belief can also arise when people expect a frequently appearing jodi to continue.
Both assumptions misread historical independence. An absence describes the past; it does not create a debt that future outcomes must repay.
Use Records for Factual Review
Readers gain the clearest value when they use charts to verify dates, organize completed outcomes, detect mistakes, and compare defined periods. These tasks rely on recorded evidence rather than speculation.
Moreover, maintaining a fixed purpose reduces emotional interpretation. Historical records work best as archives, not promises.
Preserving Accurate Historical Records
Strong recordkeeping protects the reliability of every later comparison. Whether a chart covers one month or several years, consistent formatting and verification help prevent small mistakes from spreading.
Use a Standard Layout
A standard record should include:
- Full date
- Weekday
- Opening digit
- Closing digit
- Final jodi
- Status for closed sessions
- Correction notes when required
Consistent fields make entries easier to audit. Additionally, they allow readers to compare separate periods without relearning the layout.
Verify Before Updating
Each result should undergo a basic check before entering the permanent archive. If full panels remain available, the opening and closing calculations should match the final jodi.
Meanwhile, corrections should preserve a visible note or revision date. Silent changes may solve one error but create doubt about the record’s history.
Protect Older Data
Digital backups prevent accidental loss, while dated versions preserve earlier states of the chart. Printed records should remain dry, legible, and arranged chronologically.
Most importantly, uncertain entries should carry a clear status. Marking information as unverified protects accuracy better than presenting an assumption as fact.
Conclusion
The Kalyan Jodi Chart developed from handwritten daily notes into structured weekly, monthly, and digital archives. Its two-digit format condenses opening and closing results, making historical checking faster and easier. Accurate interpretation depends on date alignment, digit order, complete records, and careful verification. Although repetitions, doubles, reverse pairs, and gaps may appear meaningful, they only describe completed outcomes. Readers should treat chart history as a factual recordkeeping resource and never as a guarantee of future results.
FAQs
What information does a Kalyan Jodi Chart contain?
It usually contains dated two-digit results arranged by day, week, or month. The first digit represents the opening side, while the second represents the closing side. Some versions also display full panels, closed-day symbols, correction marks, or monthly divisions that provide extra historical context.
Why do some dates have blank entries?
A blank entry may indicate a holiday, closed session, missing record, delayed update, or unavailable historical information. It should not be interpreted as zero unless the chart explicitly states that meaning. Readers should check the date sequence and any accompanying symbols before concluding.
Can past Jodi results predict future outcomes?
No historical sequence can guarantee a future result. Frequencies, repeated pairs, gaps, and mirrored digits describe only completed sessions. Although readers can calculate historical statistics, those figures do not create certainty. Any claim that a chart produces a fixed future jodi misrepresents the purpose of recorded data.
What is the difference between a jodi and a panel?
A jodi contains two digits representing the opening and closing results. A panel usually contains three digits associated with one side of the session. Therefore, a complete record may show an opening panel, opening digit, closing panel, closing digit, and the final two-digit jodi.
How can readers identify an incorrect chart entry?
Readers can compare the jodi with its opening and closing panels, verify the date against another independently maintained record, and inspect nearby cells for alignment problems. Reversed digits, shifted weekdays, and missing blank spaces commonly reveal transcription errors. Uncertain values should remain marked as unverified.
Why do different charts sometimes show conflicting results?
Conflicts often arise from typing errors, reversed digits, incorrect date alignment, delayed corrections, or incomplete source records. Different formatting conventions can also create confusion. Readers should compare the year, date, weekday, panels, and revision notes before deciding which entry has stronger historical support.